Sherlock
Holmes and Dr. Watson are camping in the countryside.
In
the middle of the night Holmes wakes up Watson:
'Watson,
what do you think these stars are telling us?
'Geez,
Holmes, I don't know, maybe it's going to be a nice weather tomorrow?
'Elementary,
Watson! They are telling us our tent has been stolen!
Iconic
Soviet joke.
Estimating a hockey
player via Elo ratings is a highly complex task. Therefore, we shall
wield the dialectic approach of getting from the simpler to the more
complicated, and will tackle a seemingly simplistic task first. Let's
work out the Elo ratings for the NHL teams as a whole first. After
all, it's the teams who compete against each other, and the outcome
of this competition is a straightforward result.
So, let's examine a
match between Team A and Team B. They have ratings Ra
and Rb. These ratings, or, more precisely,
their difference Ra-Rb, defines the expected
results Ea and Eb on the scale from 0 to 1. The
teams play, one wins (S=1), another loses (S=0). To adapt this to the
Elo scale, let's consider win 1 point, loss 0 point. The new ratings
Ra' and Rb' will be (K is
the volatility coefficient):
Outcome
|
Sa
|
Sb
|
Sa-Ea
|
Sb-Eb
|
dRa
|
dRb
|
Ra'
|
Rb'
|
|---|---|---|---|---|---|---|---|---|
Team A Wins
|
1
|
0
|
1-Ea
|
-Eb
|
K-K*Ea
|
-K*Eb
|
Ra+K-K*Ea
|
Rb-K*Eb
|
Team B Wins
|
0
|
1
|
-Ea
|
1-Eb
|
-K*Ea
|
K-K*Eb
|
Ra-K*Ea
|
Rb+K-K*Eb
|
and the teams are
ready for usage in the next meeting with their new ratings Ra'
and Rb', reciprocally.
'Wait!', will
ask the attentive reader, 'Not all possible outcomes are listed
above! What about the OT/SO wins where both teams get some points.'
And he will be correct. In these cases we must admit that the loser
team scores 0.5 points, so unlike a chess game where the sum of the
results is always 1, in the NHL hockey the total sum of results
varies and can be either 1 or 1.5. Note, were the scoring system
3-2-1-0, then we could scale the scores by 3 rather than by two and
get the range 1-⅔-⅓-0 where every result sums to 1. Alas, with
the existing system we must swallow the ugly fact that the total
result may exceed 1, and as the result the ratings get inflated.
Which is a bad thing, sure.
Or is it? Remember,
the Elo expectation function only cares about the differences between
ratings, not their absolute values. And all teams' ratings get
inflated, so all absolute values shift up from where they would've
been without the loser's point. Whom would it really hurt? The new
teams. Naturally, we must assign an initial rating to every team at
the starting point. One way could be assigning the average rating of
the previous season to the new team. But we prefer a different and a
much more comprehensive solution. We claim that since the teams that
at the start of the next season are different enough beasts from
those that ended the previous ones, so that the Elo ratings should
not carry over from season to season at all! Therefore all the
teams start each season with a clean plate and an identical Elo
rating Ro.
Once again, the
attentive reader might argue, 'What about mid-season trades and other
movements?' Well, dear reader, now you have a tool to evaluate impact
of the moves on the team. If there is a visible tendency change, you
can quite safely associate it with that move. Overall, the 82 game
span is huge to soften any bends and curves in the progression of the
Elo ratings along the season.
Speaking of game
spans, we must note one more refinement being done to the ratings. In
the chess world, the ratings of the participants are not updated
throughout the length of the event, which is usually 3-11 games. The
ratings of the participants are deemed constant for the calculation
of rating changes, which accumulate, and the accumulation is actually
the rating change of each participant. We apply a similar technique
for the teams' Elo calculations: we accumulate the changes for the
ratings for 5 games for each team and "commit" the changes
after the five-game span. The remainder of the games is committed
regardless of its length, from 1 to 5. Why 5? We tried all kinds of
spans, and 5 gave the smoothest look and the best projections.
Now, as a
demonstration, let's show how we calculate the possible rating
changes in the much anticipated game where Minnesota Wild is hosting
Columbus Blue Jackets on December, 31st, 2016:
Rcbj = 2250, Rmin =
2196, Ecbj = 0.577, Emin = 0.423, K = 32 (standard USCF).
Outcome
|
Scbj
|
Smin
|
S-Ecbj
|
S-Emin
|
dRa
|
dRb
|
Ra'
|
Rb'
|
|---|---|---|---|---|---|---|---|---|
CBJ W Reg
|
1
|
0
|
0.423
|
-0.423
|
+13.53
|
-13.53
|
2263.53
|
2182.47
|
CBJ W OT
|
1
|
0.5
|
0.423
|
0.077
|
+13.53
|
+2.47
|
2263.53
|
2198.47
|
MIN W OT
|
0.5
|
1
|
-0.077
|
0.577
|
-2.47
|
+18.47
|
2247.53
|
2214.47
|
MIN W Reg
|
0
|
1
|
-0.577
|
0.577
|
-18.47
|
+18.47
|
2231.53
|
2214.47
|
Note:
MIN gains rating when it gets a loser's point.
Here is a dynamic of
Elo changes (without five game accumulation) for the Metropolitan
Division, as an example.
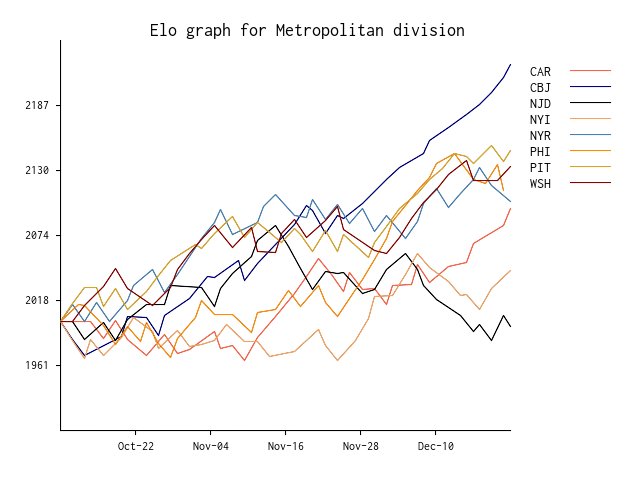
See more detailed
tables on our website: http://morehockeystats.com/teams/elo
Ok, we got the
ratings, we got the expected results, can we get something more out
of it?
To be continued...
Happy New Year to
everyone!
No comments:
Post a Comment