Showing posts with label 3-2-1-0. Show all posts

Saturday, December 31, 2016

On Players Evaluation - Part III (Teams Elo)


Sherlock Holmes and Dr. Watson are camping in the countryside.
In the middle of the night Holmes wakes up Watson:
'Watson, what do you think these stars are telling us?
'Geez, Holmes, I don't know, maybe it's going to be a nice weather tomorrow?
'Elementary, Watson! They are telling us our tent has been stolen!

Iconic Soviet joke.

Estimating a hockey player via Elo ratings is a highly complex task. Therefore, we shall wield the dialectic approach of getting from the simpler to the more complicated, and will tackle a seemingly simplistic task first. Let's work out the Elo ratings for the NHL teams as a whole first. After all, it's the teams who compete against each other, and the outcome of this competition is a straightforward result.

So, let's examine a match between Team A and Team B. They have ratings Ra and Rb. These ratings, or, more precisely, their difference Ra-Rb, defines the expected results Ea and Eb on the scale from 0 to 1. The teams play, one wins (S=1), another loses (S=0). To adapt this to the Elo scale, let's consider win 1 point, loss 0 point. The new ratings Ra' and Rb' will be (K is the volatility coefficient):

Outcome
Sa
Sb
Sa-Ea
Sb-Eb
dRa
dRb
Ra'
Rb'
Team A Wins
1
0
1-Ea
-Eb
K-K*Ea
-K*Eb
Ra+K-K*Ea
Rb-K*Eb
Team B Wins
0
1
-Ea
1-Eb
-K*Ea
K-K*Eb
Ra-K*Ea
Rb+K-K*Eb

and the teams are ready for usage in the next meeting with their new ratings Ra' and Rb', reciprocally.

'Wait!', will ask the attentive reader, 'Not all possible outcomes are listed above! What about the OT/SO wins where both teams get some points.' And he will be correct. In these cases we must admit that the loser team scores 0.5 points, so unlike a chess game where the sum of the results is always 1, in the NHL hockey the total sum of results varies and can be either 1 or 1.5. Note, were the scoring system 3-2-1-0, then we could scale the scores by 3 rather than by two and get the range 1-⅔-⅓-0 where every result sums to 1. Alas, with the existing system we must swallow the ugly fact that the total result may exceed 1, and as the result the ratings get inflated. Which is a bad thing, sure.

Or is it? Remember, the Elo expectation function only cares about the differences between ratings, not their absolute values. And all teams' ratings get inflated, so all absolute values shift up from where they would've been without the loser's point. Whom would it really hurt? The new teams. Naturally, we must assign an initial rating to every team at the starting point. One way could be assigning the average rating of the previous season to the new team. But we prefer a different and a much more comprehensive solution. We claim that since the teams that at the start of the next season are different enough beasts from those that ended the previous ones, so that the Elo ratings should not carry over from season to season at all! Therefore all the teams start each season with a clean plate and an identical Elo rating Ro.

Once again, the attentive reader might argue, 'What about mid-season trades and other movements?' Well, dear reader, now you have a tool to evaluate impact of the moves on the team. If there is a visible tendency change, you can quite safely associate it with that move. Overall, the 82 game span is huge to soften any bends and curves in the progression of the Elo ratings along the season.

Speaking of game spans, we must note one more refinement being done to the ratings. In the chess world, the ratings of the participants are not updated throughout the length of the event, which is usually 3-11 games. The ratings of the participants are deemed constant for the calculation of rating changes, which accumulate, and the accumulation is actually the rating change of each participant. We apply a similar technique for the teams' Elo calculations: we accumulate the changes for the ratings for 5 games for each team and "commit" the changes after the five-game span. The remainder of the games is committed regardless of its length, from 1 to 5. Why 5? We tried all kinds of spans, and 5 gave the smoothest look and the best projections.

Now, as a demonstration, let's show how we calculate the possible rating changes in the much anticipated game where Minnesota Wild is hosting Columbus Blue Jackets on December, 31st, 2016:

Rcbj = 2250, Rmin = 2196, Ecbj = 0.577, Emin = 0.423, K = 32 (standard USCF).

Outcome
Scbj
Smin
S-Ecbj
S-Emin
dRa
dRb
Ra'
Rb'
CBJ W Reg
1
0
0.423
-0.423
+13.53
-13.53
2263.53
2182.47
CBJ W OT
1
0.5
0.423
0.077
+13.53
+2.47
2263.53
2198.47
MIN W OT
0.5
1
-0.077
0.577
-2.47
+18.47
2247.53
2214.47
MIN W Reg
0
1
-0.577
0.577
-18.47
+18.47
2231.53
2214.47
Note: MIN gains rating when it gets a loser's point.

Here is a dynamic of Elo changes (without five game accumulation) for the Metropolitan Division, as an example.
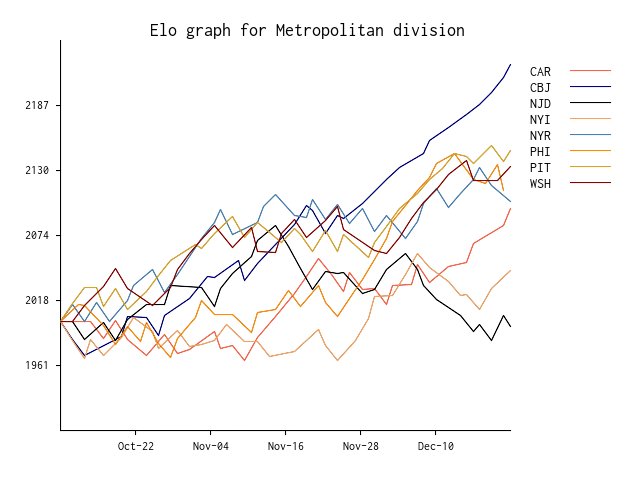

See more detailed tables on our website: http://morehockeystats.com/teams/elo

Ok, we got the ratings, we got the expected results, can we get something more out of it?

To be continued...

Happy New Year to everyone!

Wednesday, December 21, 2016

On The NHL Scoring System (Part I)

There was nothing wrong with ties. The 2-1-0 point system works fine in various sports around the world. It's just ... not fitting into the mind of a North American sports fan. "Who won?" - "It was a tie." - "Who won on a tiebreak?" Basketball and baseball do not have ties, and American Football has them at a rate of 1-2 times per whole season. So more than ten years ago NHL went with the flow and abolished ties, introducing the shootout, and with a twist, where the team making it past the regulation would still get the point, and a 2-2-1-0 point system came to life.

Since then the argument rages, whether the ties should come back, or whether the consolation point should be taken away, or whether the much more energetic 3-2-1-0 point system, adopted across the ocean and by the IIHF should make its way into the NHL as well. The feeling that there is something unhealthy when a team loses and still gets something, while the winner is not penalized is nagging.

The argument from the NHL leadership claims the system creates denser standings and thus more interest and drama throughout the season is a valid one. However, this system, as we show below, creates a wrong incentive.

The standings in the NHL are defined by a points total, and the seeding in the playoffs are first and foremost the divisional standings. The relative standings across conferences have a rather minor effect of the potential home advantage in the Stanley Cup Finals, the same standings within the same conference but across divisions have an impact on the seedings in the whole playoffs, but also to a limited effect. Therefore, at least with the exception of intradivisional games, but possibly including these games too (especially against the competition that has fallen out of the playoff picture), the only thing that matters are the points accrued by the team itself, and not the points the opposition gathers. Let's wield the statistic that says that 25% of the games go to the overtime and the

So what are the point expectations in a 2-2-1-0 system? Let's compare a few situations when teams A and B play.

  1. Team A has 75% chance of winning the game (that's a huge, possibly maximum imaginable favorite odds)
  2. Team A has 67% chance of winning.
  3. Team A has 60% chance of winning.
  4. Team A has 50% chance of winning.


Let's wield the statistic that says that 25% of all games go to the overtime and the shootout occurs in 40% of these games. Let's also assume that the 3-vs-3 overtime is more random and reduces by half the advantage of the better team (i.e. 75-25 becomes 62.5-37.5), and that the shootout is completely random, so the chances of winning it are 50/50. Then, the probabilities of the outcome become:

ChancePwRegPwOTPwSOxPoints
Team A75%0.56250.093750.051.51875
Team B25%0.18750.056250.050.73125
Team A67%0.50250.087750.051.39275
Team B33%0.24750.062250.050.85725
Team A60%0.450.08250.051.2825
Team B40%0.30.06750.050.9675
Team A50%0.3750.0750.051.125
Team B50%0.3750.0750.051.125

Now let's consider than the stronger team A plays intentionally for overtime and manages to force it in 75% of the cases.

ChancePwRegPwOTPwSOxPoints
Team A75%0.18750.281250.151.55625
Team B25%0.06250.168750.151.19375
Team A67%0.16750.263250.151.49825
Team B33%0.08250.186750.151.25175
Team A60%0.150.24750.151.4475
Team B40%0.10.20250.151.3025
Team A50%0.1250.2250.151.375
Team B50%0.1250.2250.051.375

In ALL cases it's worth for both teams to steer the game into OT. For the even odds case, the expectation gain is a whopping 0.25 points! Even in the case of super, uber favorite, it's still worth for that team to head to overtime, as it projects a gain of 0.04 points. And the gains for the underdogs are so big that there is no reason for the underdog to disturb the force of the overtime, so they will happily comply! Meaning: we'll see more fun overtime, we'll see more dumb shootouts, but more importantly the 60 minutes of hockey will lose a lot of their significance. The only quantative incentive to finish the game in regulation becomes denying extra points for your opponents - hardly a significant matter in what, fifty out of the eighty-two season games!

Now, let's repeat these calculations with 3-2-1-0 point system and combine them into another table:

2-2-1-03-2-1-0
ChanceExp25%OTExp75%OTΔexpExp25%OTExp75%OTΔexp
Team A 75% 1.51875 1.55625 +0.0375 2.08125 1.74375 -0.3375
Team B 25% 0.73125 1.19375 +0.4625 0.91875 1.25625 +0.3375
Team A 67% 1.39275 1.49825 +0.1055 1.89525 1.66575 -0.2295
Team B 33% 0.85725 1.25175 +0.3945 1.10475 1.33425 +0.2295
Team A 60% 1.2825 1.4475 +0.165 1.7325 1.5975 -0.135
Team B 40% 0.9675 1.3025 +0.335 1.2675 1.4025 +0.135
Team A 50% 1.125 1.375 +0.25 1.5 1.5 0
Team B 50% 1.125 1.375 +0.25 1.5 1.5 0

Now there is no incentive for the stronger team to push for overtime, and even the gain for the weaker team decreased. 3-2-1-0 definitely encourages a regulation decision!

Reasons where brought up against the 3-2-1-0 system. One states that the spread over the standings will be too thin, and more teams will be eliminated from the playoff race early. This argument has had no statistical support, and the element of drama when a team pulls a goalie in a tied score trying to force a 3-0 point win may actually more than make up for it. Another argument refers to soccer studies that claim the 3-1-0 point system there encourages teams to sit on their early leads trying to stifle the game, which decreases the attractiveness of the game. This argument is more valid, although it's notably harder to preserve a lead in hockey than in soccer. But beyond that this argument prompts for another, a truly revolutionary suggestion...

To be continued.