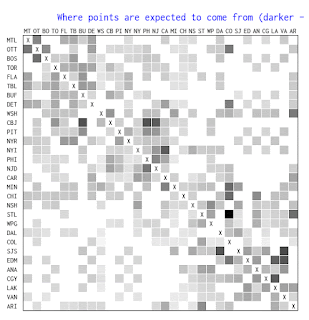
Here I would like to present visualization of the schedule of the teams, played and remaining. This is actually a graphic representation of the Buchholz/Sonneborn and teams Elo tables I present on the website.
First, let's start with the played games and points.
Naturally, most of the squares above the X-diagonal indicate more points than the ones below; however we can see interesting anomalies, such as BUF-OTT, TOR-BOS, ARI-SJS, WPG-CHI and probably the most intriguing: NYR - WSH (expected 1st round meeting)
Another unusual thing is that the Sharks are only playing Colorado twice this season rather than the regular 3-4 intraconference games.
Now let's take a look at the remaining games and the expected points.
We can see that STL may expect a big boost from having to play Colorado four(!) more times this season as well as Arizona three times and that Ottawa has two biggest season series mostly unresolved - against MTL and BOS. The expected points are being calculated based on teams Elo rating:
however for the sake of precision this number should've been scaled by 2 (since it produces an outcome between 0 and 1 (0.5 for a "tie") and also by the OT factor, i .e. the probability of a team getting an OT point, around 1.125. But for visualization purposes this does not matter.
There are also nice patters indicating travels through California and Western Canada.
First, let's start with the played games and points.
 |  |
Naturally, most of the squares above the X-diagonal indicate more points than the ones below; however we can see interesting anomalies, such as BUF-OTT, TOR-BOS, ARI-SJS, WPG-CHI and probably the most intriguing: NYR - WSH (expected 1st round meeting)
Another unusual thing is that the Sharks are only playing Colorado twice this season rather than the regular 3-4 intraconference games.
Now let's take a look at the remaining games and the expected points.
We can see that STL may expect a big boost from having to play Colorado four(!) more times this season as well as Arizona three times and that Ottawa has two biggest season series mostly unresolved - against MTL and BOS. The expected points are being calculated based on teams Elo rating:
xPts = Ngames/(1 + 10(Eloopp-Eloteam)/400))
There are also nice patters indicating travels through California and Western Canada.


No comments:
Post a Comment